Index04 SEPT 20264 min
Reactor Atlas: A Nuclear Facility Map of Earth, Across Time
Reactor Atlas is a nuclear facility map of every power and research reactor on Earth, plus the fuel cycle. Scrub history, compare nuclear reactors by country, and follow nuclear news, signals and alerts.
- Nuclear
- Engineering
- AI systems
I am a nuclear engineer, and for years the picture of the world's plants lived in a dozen official places that did not quite agree. Nobody was lying. The IAEA, national regulators, operators: they publish on different clocks, sometimes different years, and if you wanted a current picture you had to do the work of knowing which source was the source of truth this month. There was no single place to consult nuclear facility data. So I built one.
Reactor Atlas is the nuclear facility map at reactoratlas.com. Open it in a browser. The globe is the argument. The walkthrough at the top of this note is the twelve-minute tour.
A nuclear facility map, not a snapshot
What we built is a unified view of nuclear facilities: power reactors and research reactors, plus the fuel-cycle sites that sit around them, from mines through enrichment and the related stages. Switch the left panel between Power, Research and Fuel and the same Earth answers a different question.
It is not only a snapshot of the fleet today. It is a temporal record. What was operating, what was being built, what had already shut down, in any year you choose. Come closer and the clusters open: a country, then a site, then the units with the real numbers, net power, thermal power, dates, load factor. From Atucha to Flamanville, the same rigor everywhere on Earth.
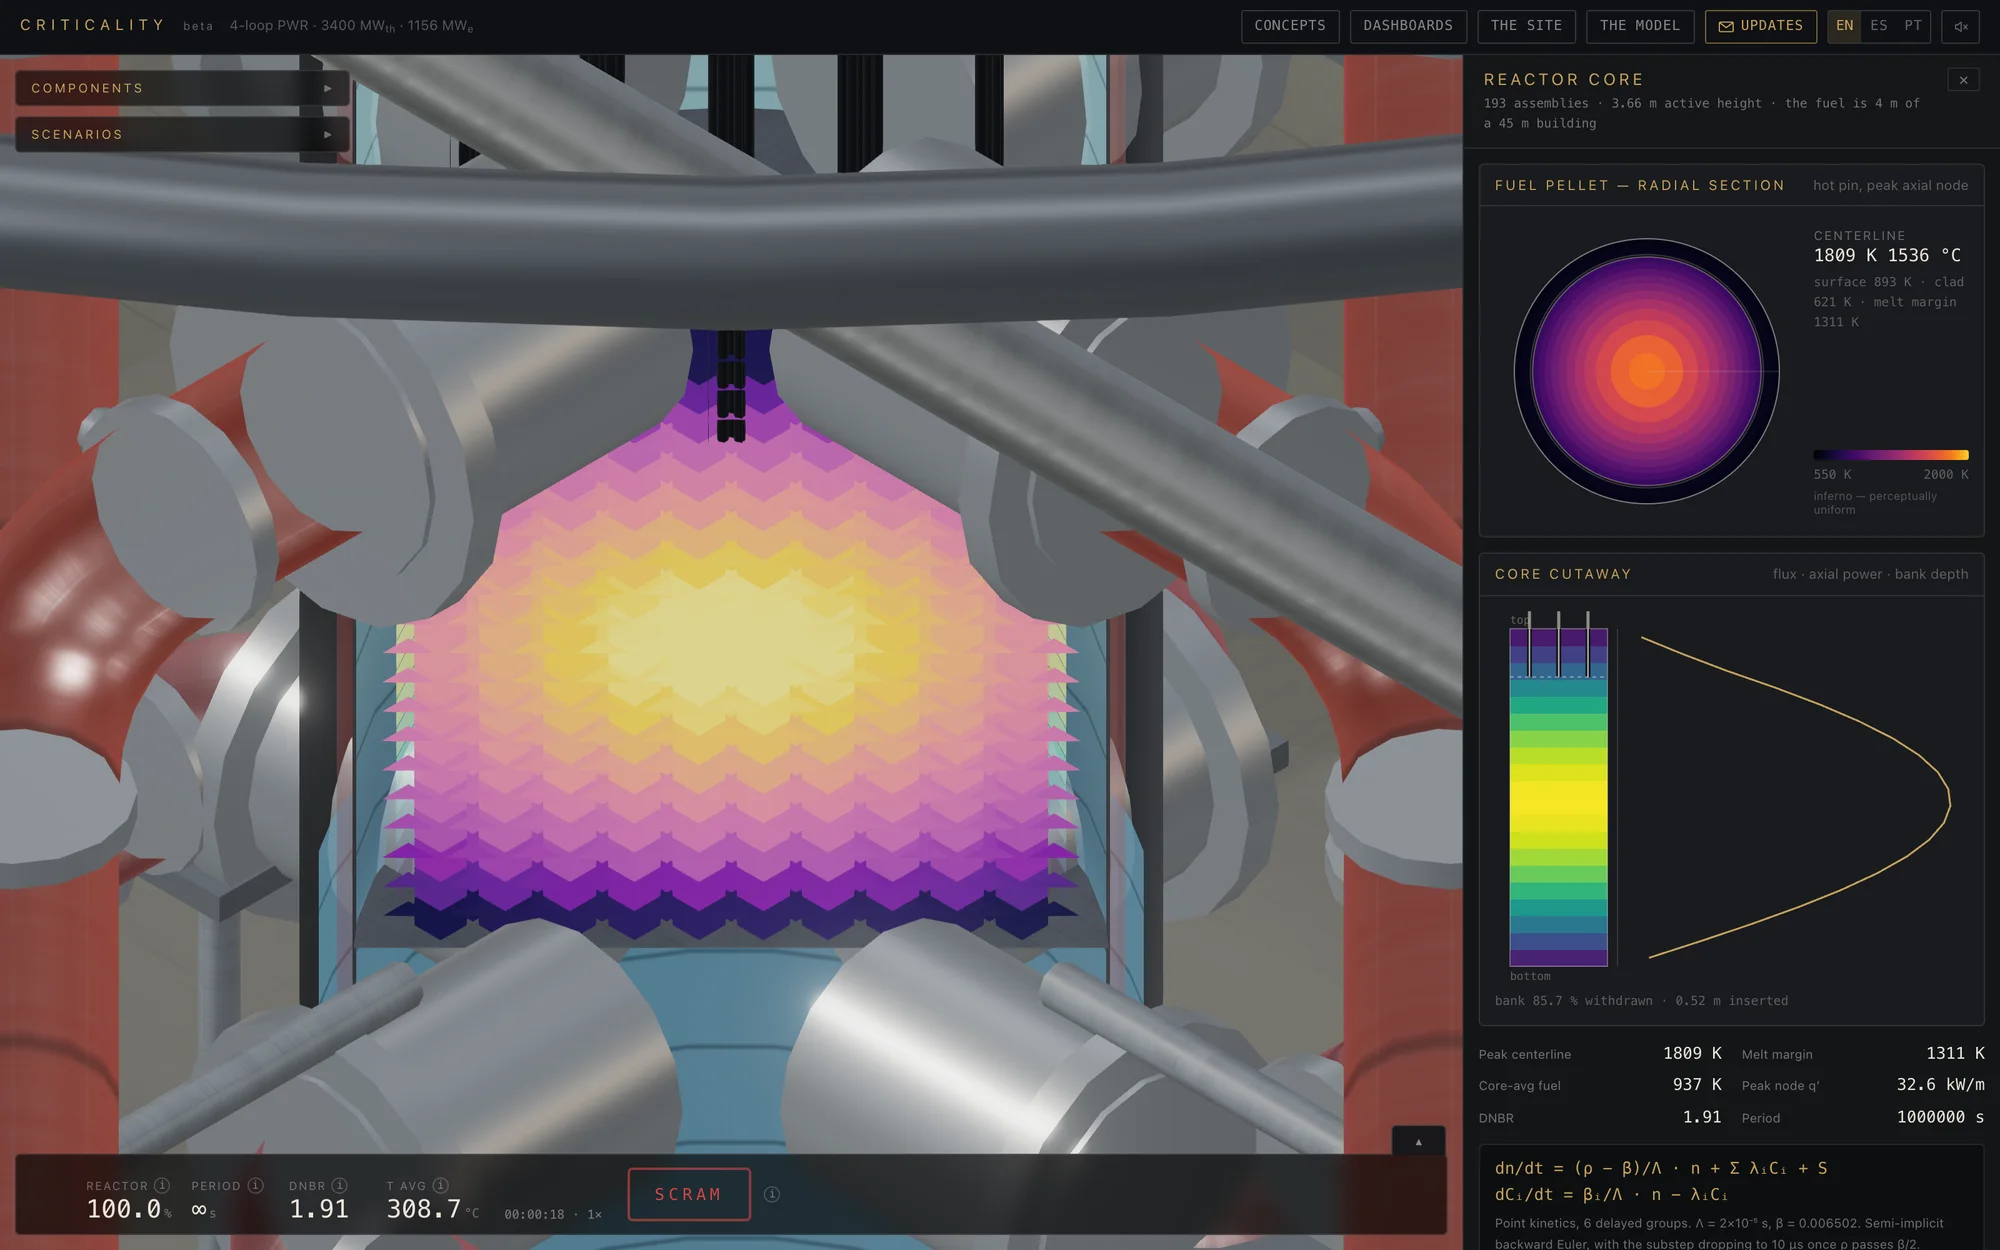
If you want to watch a single plant behave, that is Criticality, the browser simulator whose physical and numerical models I wrote up separately. If you want the whole fleet in time, that is the Atlas.
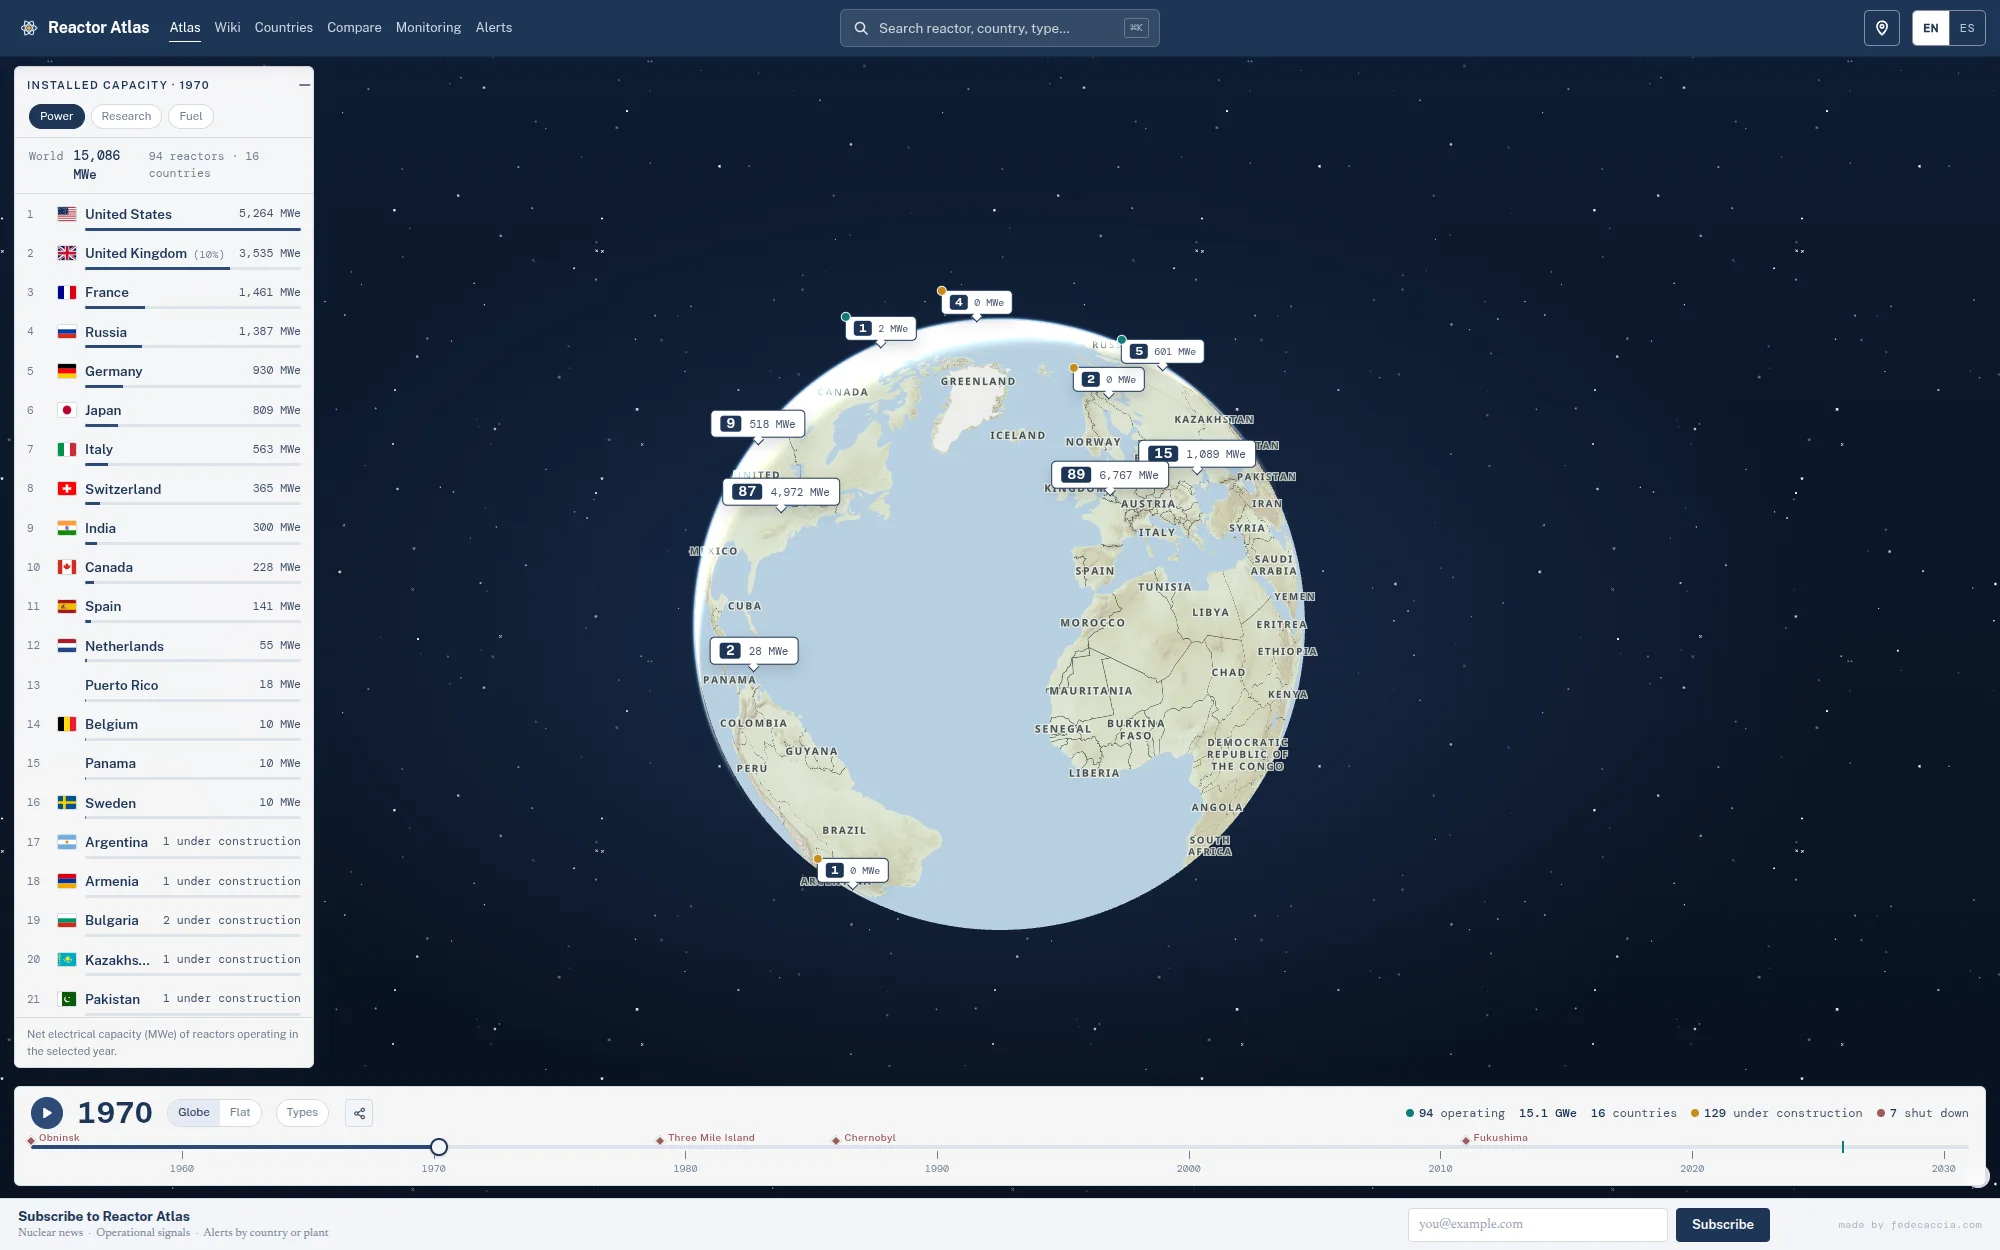
Scrub nuclear history on the time slider
This is one of the main features, and the one I would start with. A slider along the bottom of the globe runs from the 1950s into the 2030s. Scrub backward and the fleet thins: 1970 is a different planet from 2026, a handful of countries, a tenth of the capacity, and a construction boom that has not yet become the operating map. Scrub forward and the plants still under construction come into the picture, because the future of this fleet is already being poured in concrete.
Nuclear reactors by country
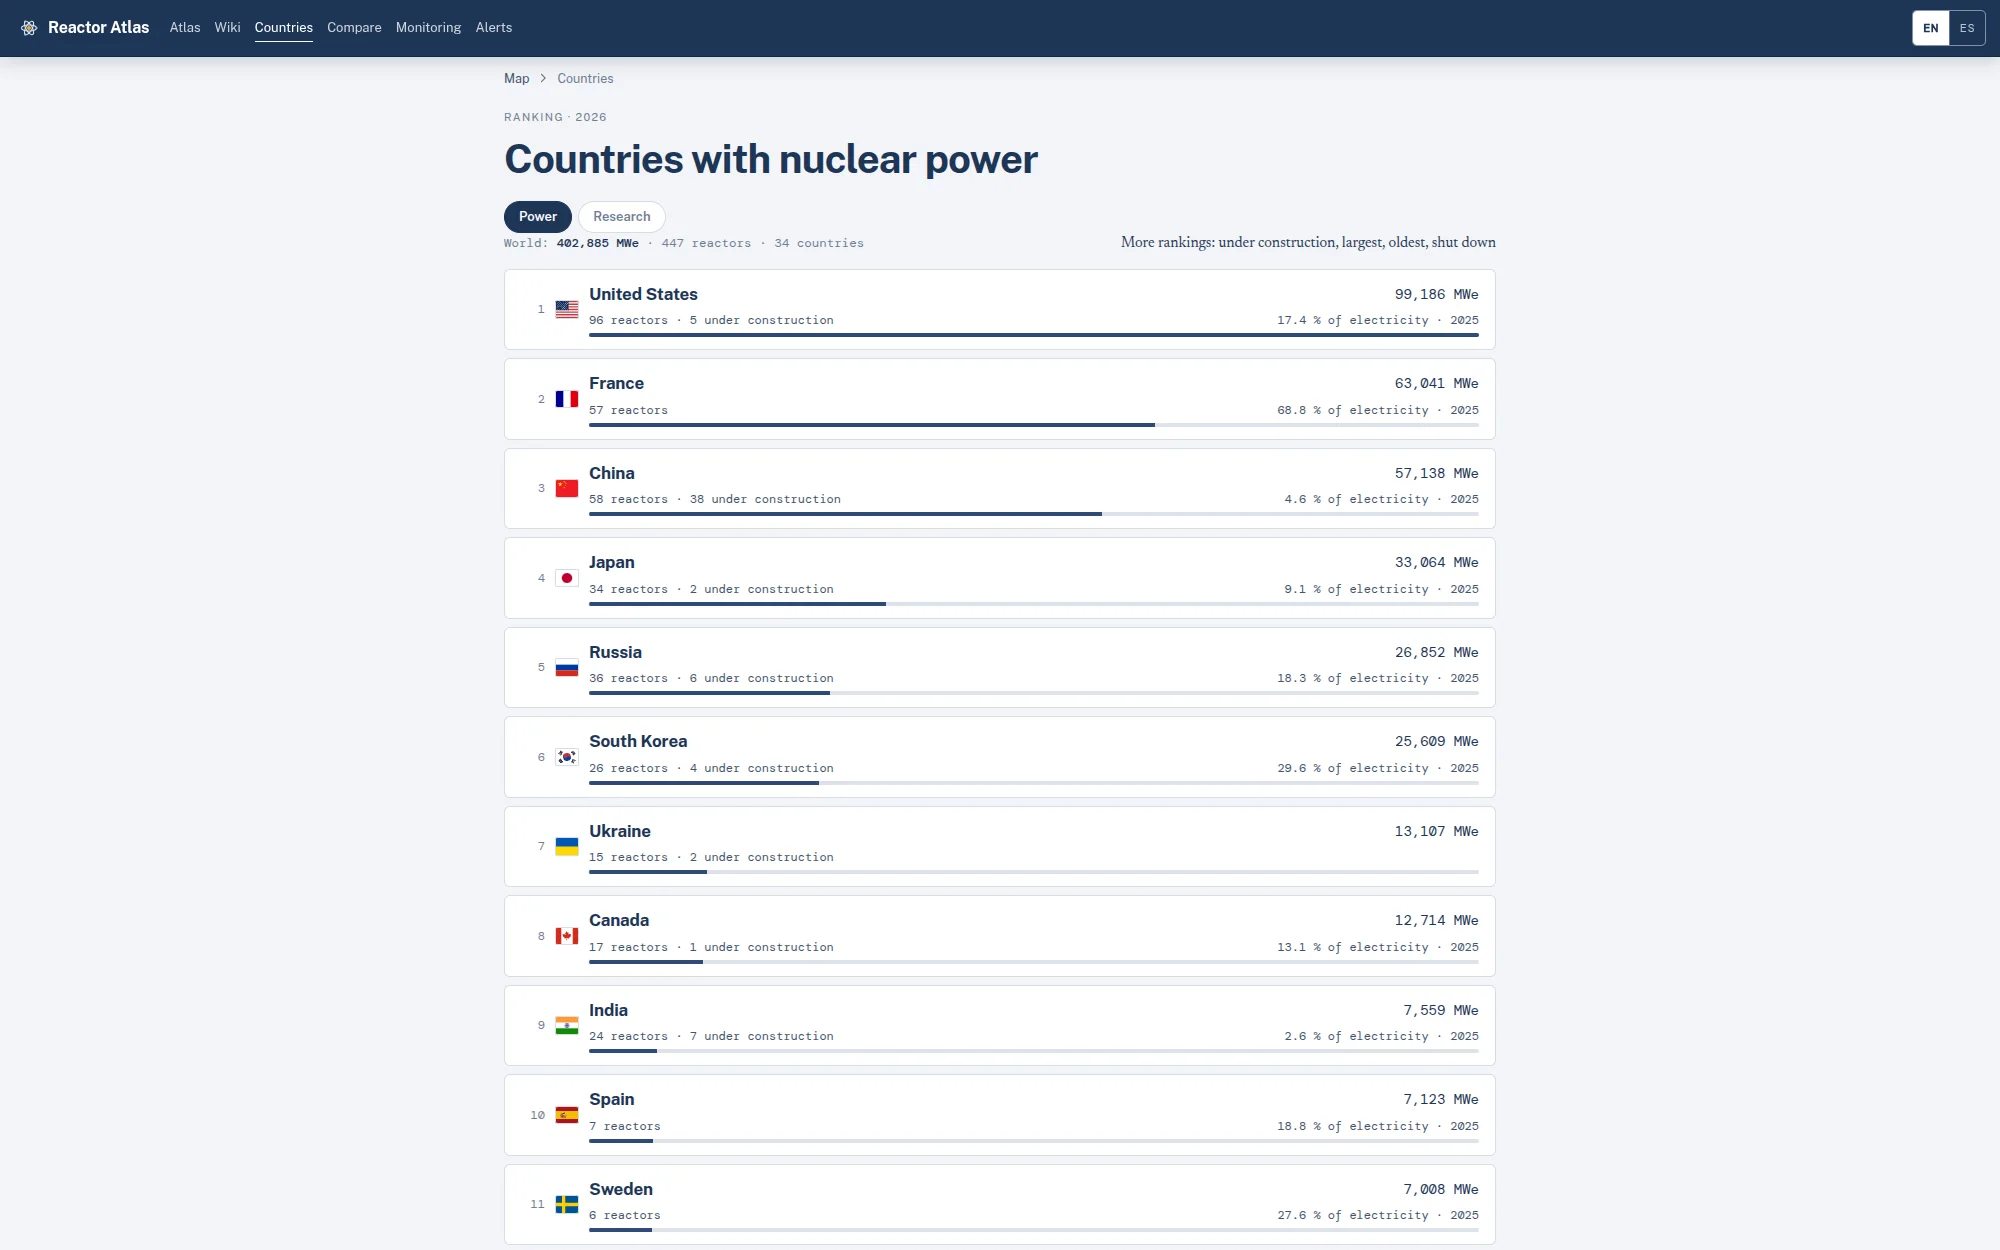
Country views sit on top of that history. You can read a country's nuclear share of its energy mix, walk a plant's own timeline, and compare plant types against each other. France and China are not the same story told at a different scale. The ranking of nuclear reactors by country makes that visible without a briefing.
How each reactor type works, and the nuclear fuel cycle
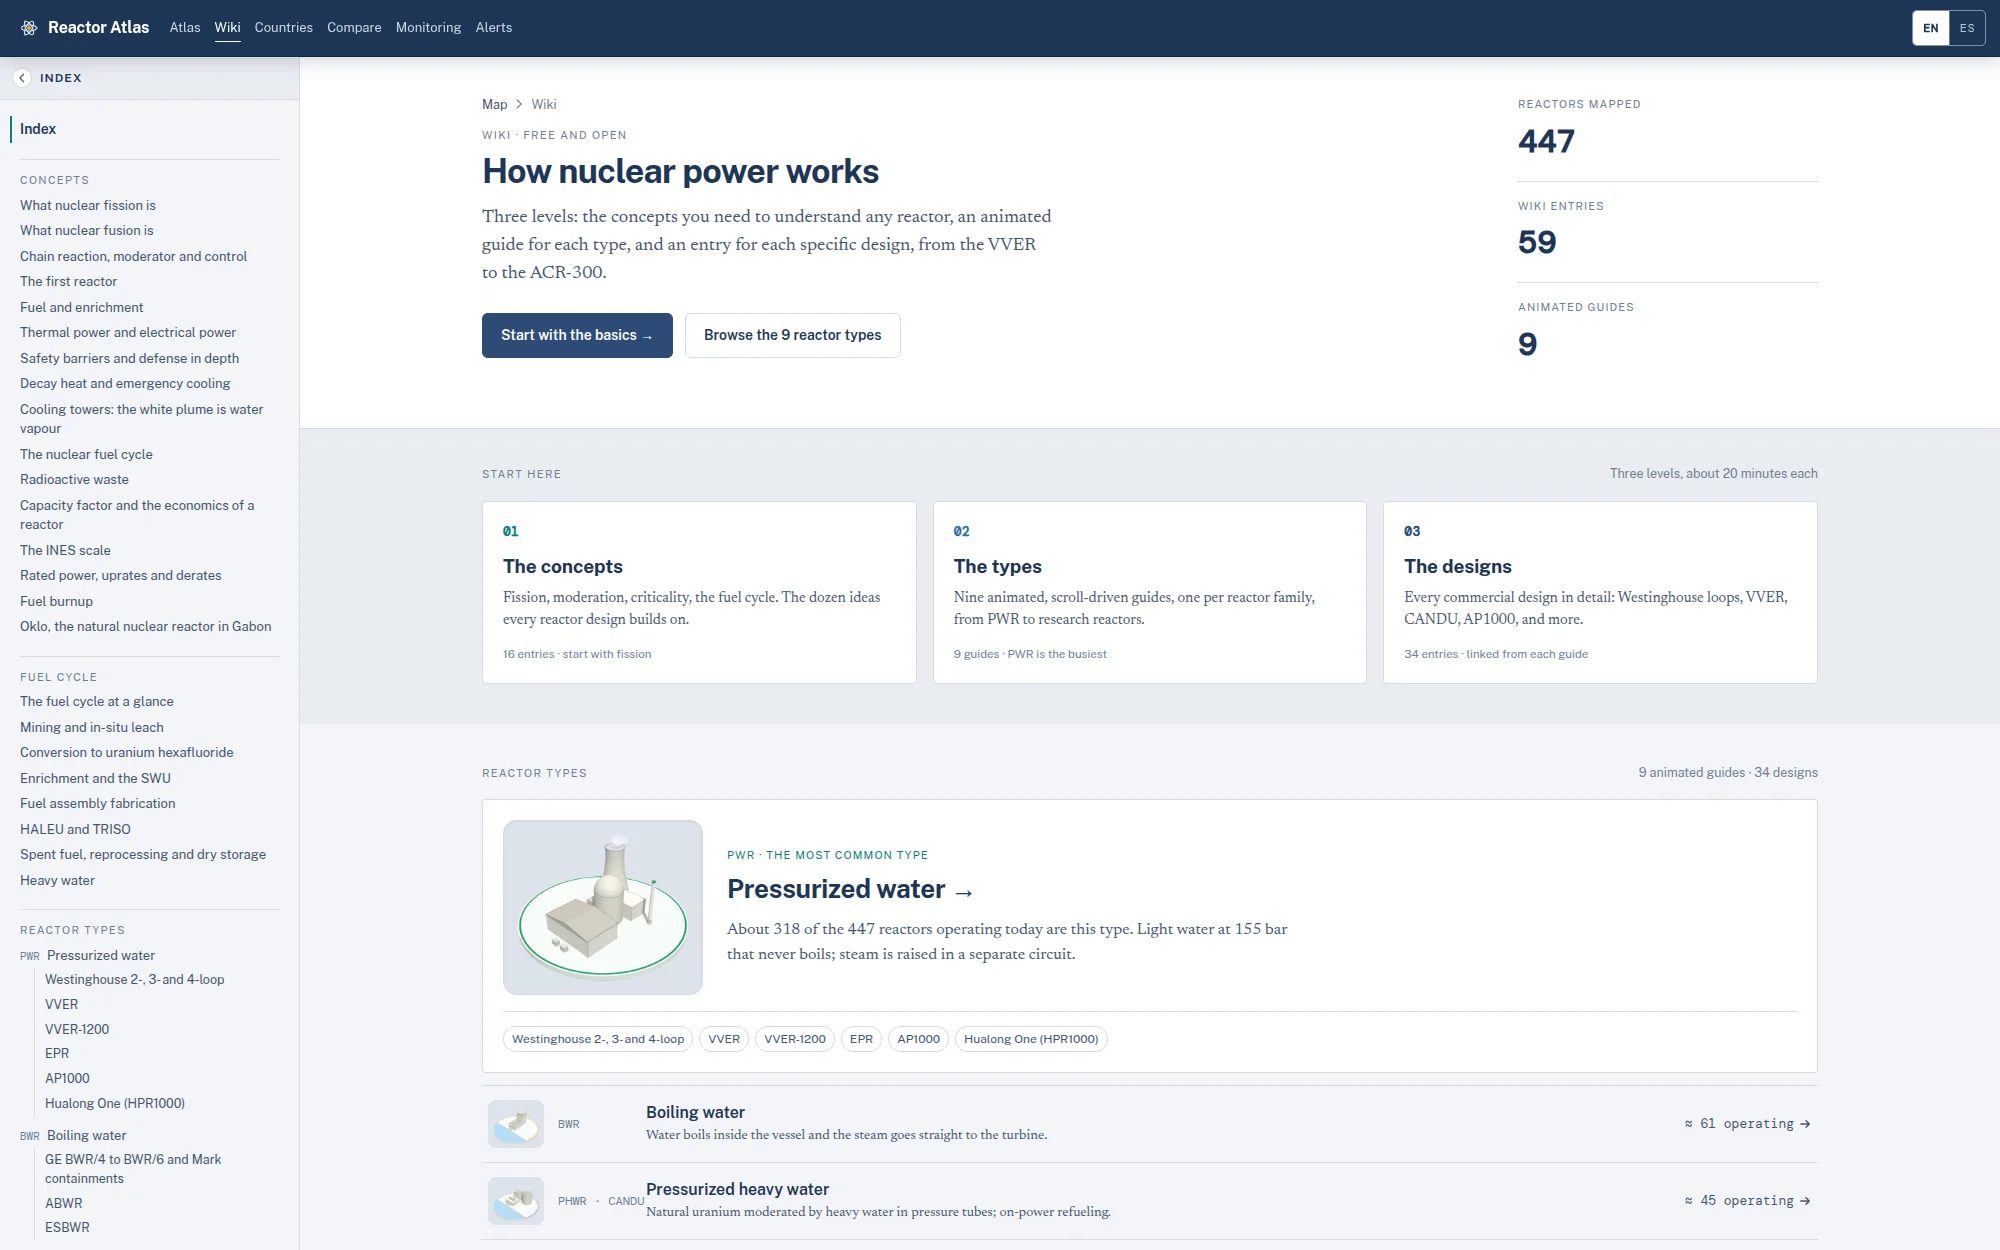
The map is the instrument. The wiki is the path in. Every reactor type has an entry that explains how it actually works, with animated guides for the families and a design page for the plants you will meet on the globe: Westinghouse loops, VVER, CANDU, EPR, AP1000. Above that sits the conceptual layer: fission, moderation, criticality, the nuclear fuel cycle, decay heat, the barriers.
I built it so someone who has never stood in a containment can start from the first principle and arrive at a specific unit they just clicked. Free, and open. That does not change.
Nuclear news, and the signals underneath it
The map tells you where the fleet is. The live layer tells you what it is doing.
We continuously index official nuclear news: operators, regulators, governments, at plant, country and international level, and we keep a second channel for specialised nuclear media. That feed is useful. It is not the core.
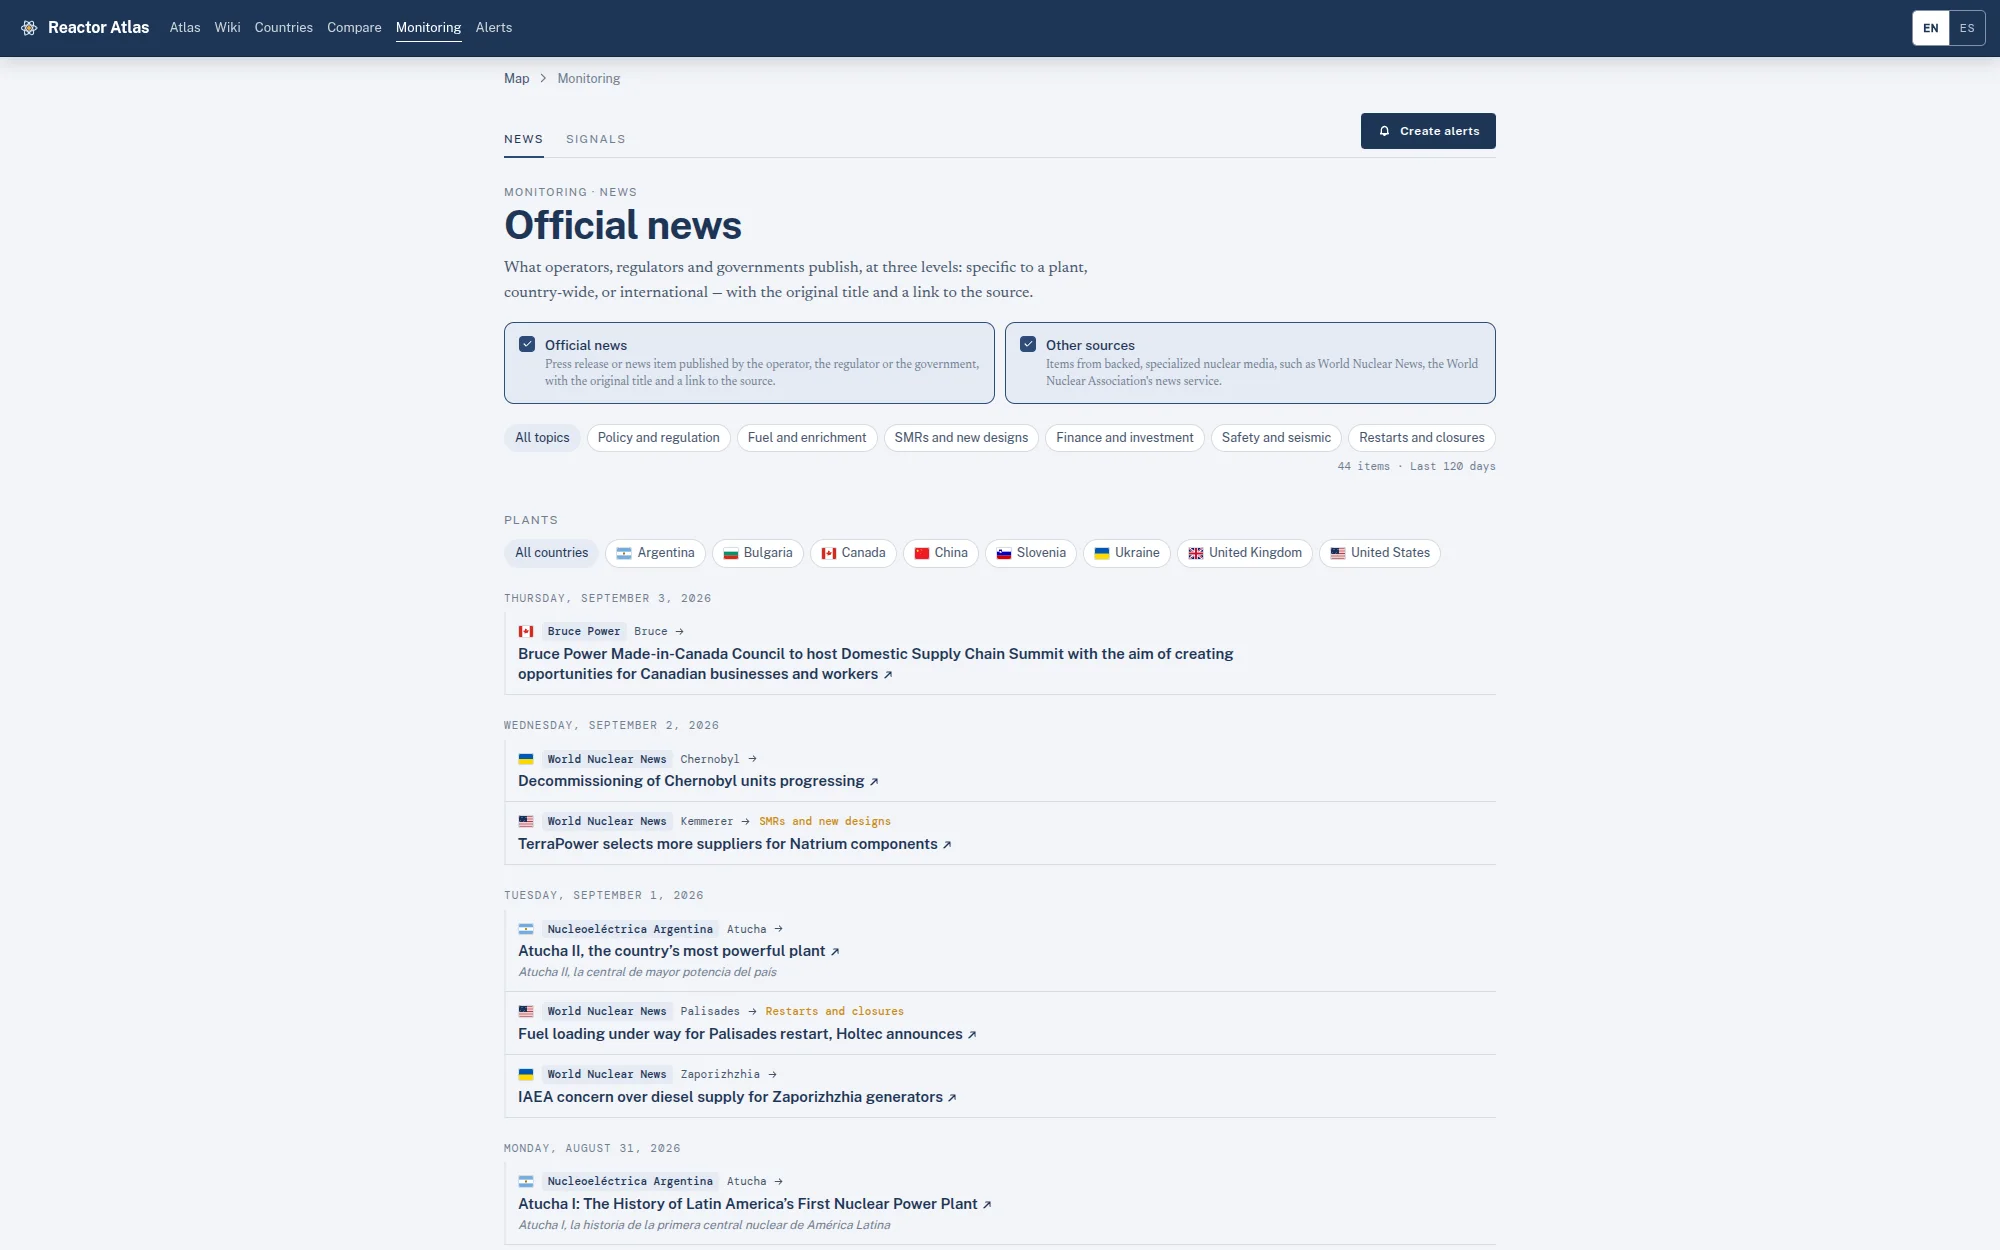
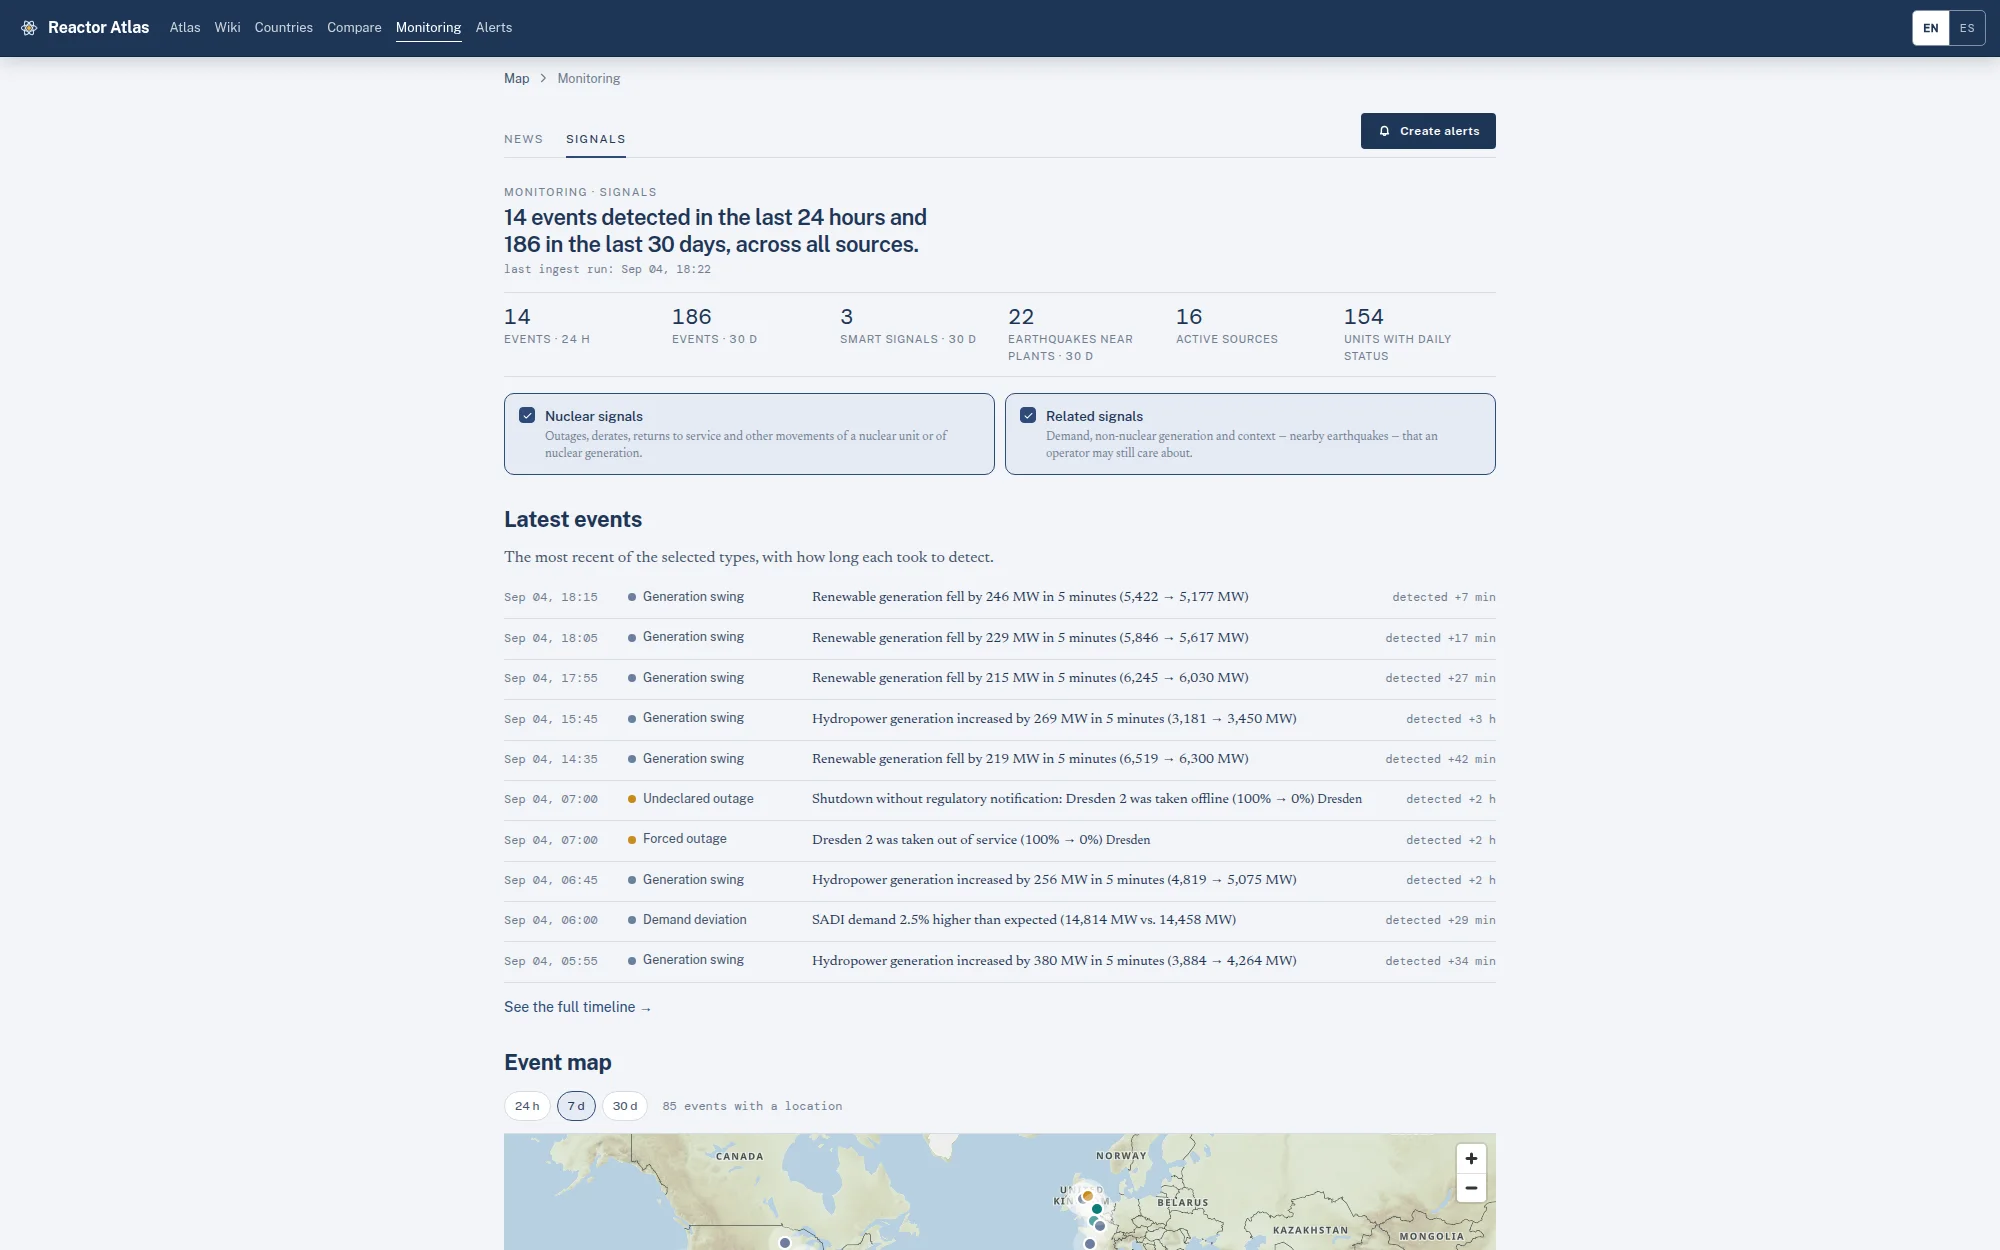
The core is signals. Outages, derates, returns to service. Demand and generation moving around a plant. Earthquakes near a site. Water-temperature and heating elevations that can affect operation. Those raw events are turned into intelligent signals: something an operator or a watcher can act on, rather than a headline they will read tomorrow. By the time it is a story, you should already know.
Nuclear alerts, in beta, free for now
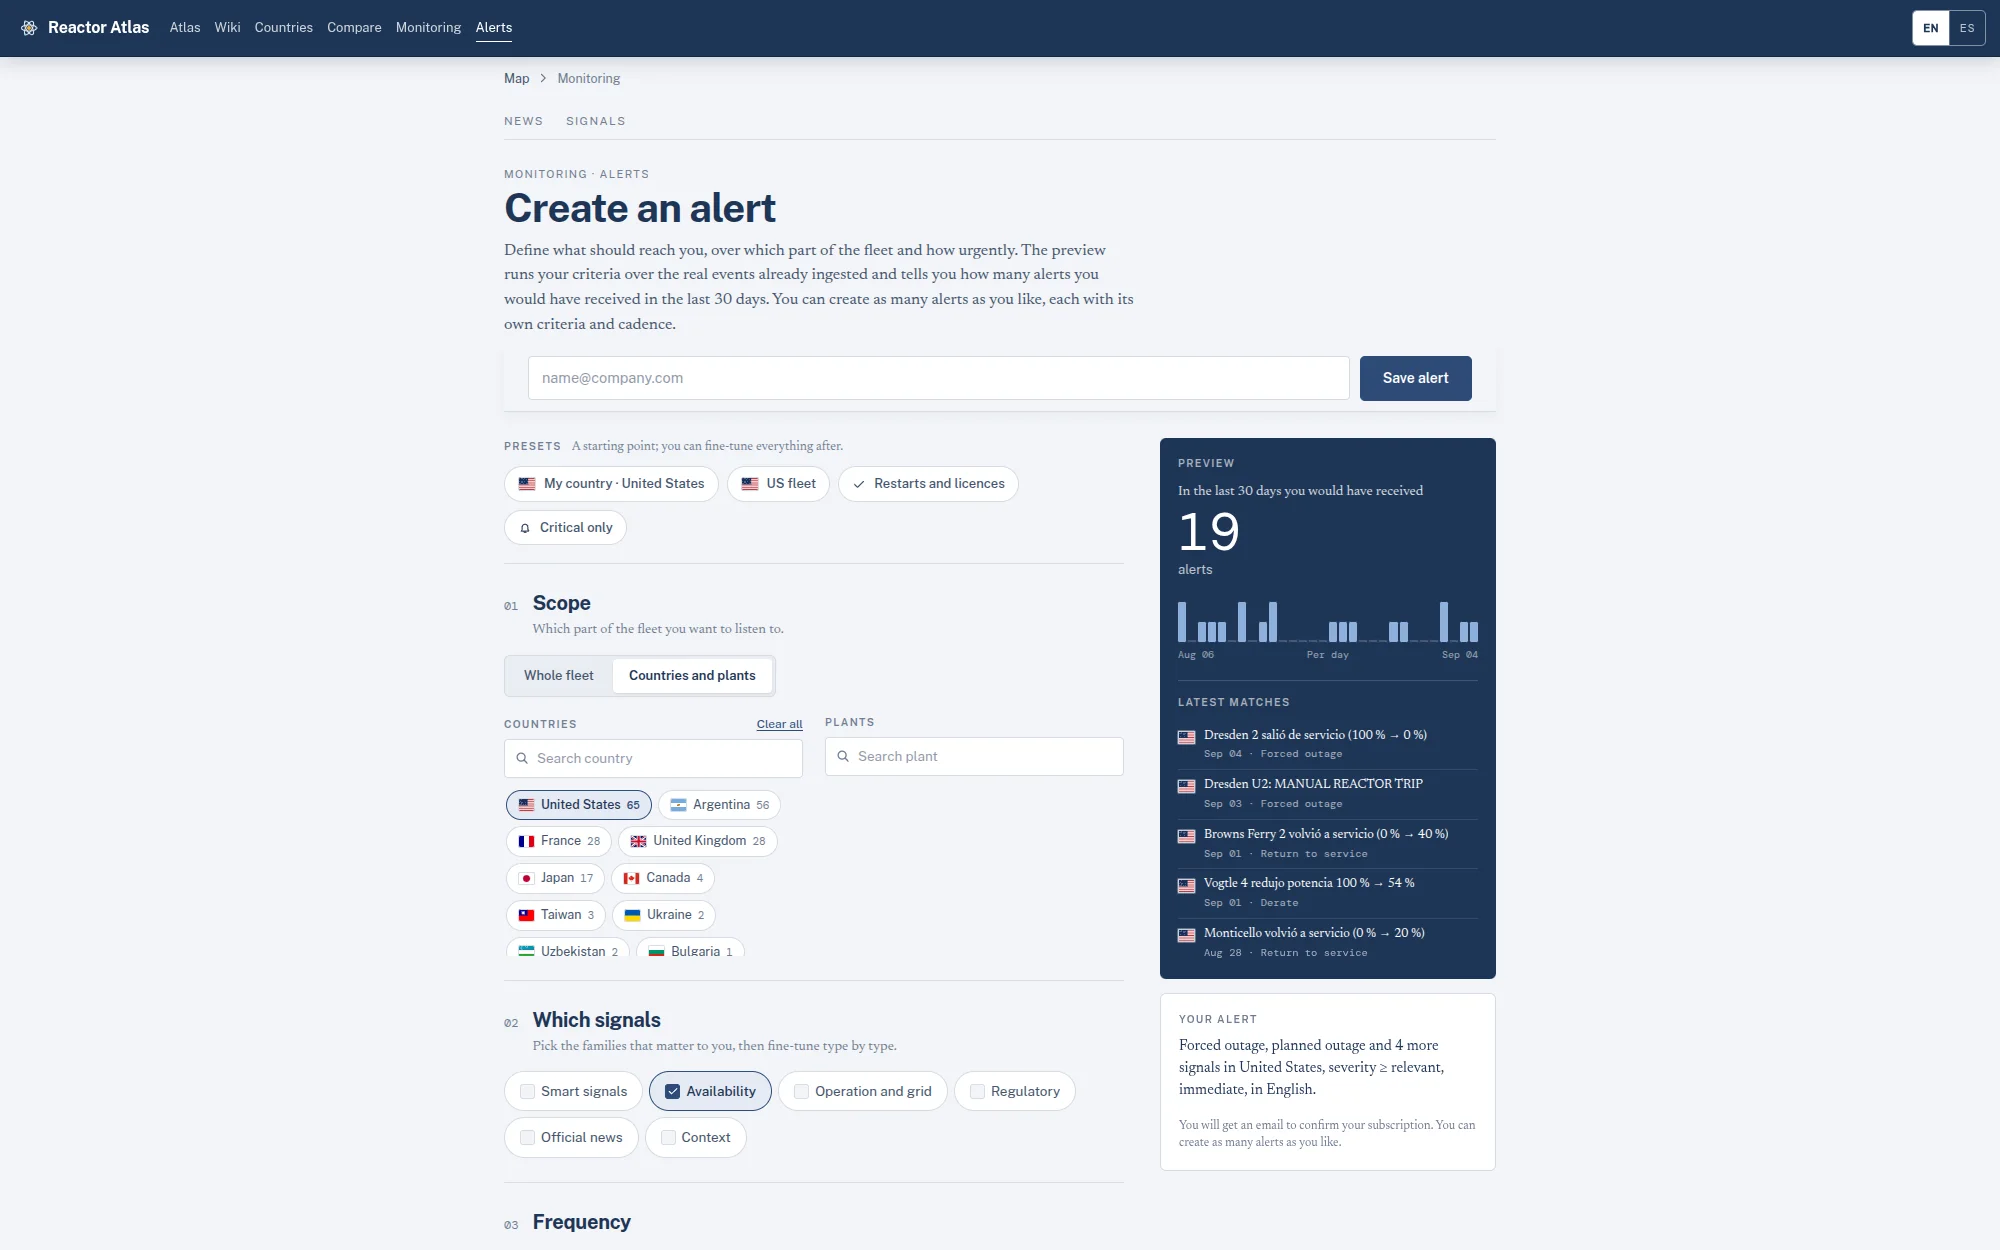
Configurable nuclear alerts launched in beta, and they are free for everyone for now. Scope them to a country or a plant, pick the signals you care about (availability, operation and grid, regulatory, official news, the smart set), and the preview will tell you how many you would have received in the last thirty days. Set one for your fleet. Set one for restarts. Set one for the river temperature that will matter in August.
The general map and the wiki stay free. Configurable alerts may not stay free forever. Use them while they are.
Open the globe
reactoratlas.com is visually strong on purpose. Turn the Earth. Scrub the slider. Open a country. Open a plant. Take screenshots. The pictures in this note are what the product looks like today, and they go stale the moment a unit changes state, which is the point.
The world's nuclear fleet, finally in one place, and moving. That is reactoratlas.com.